Bollinger Bands Forex Indicator
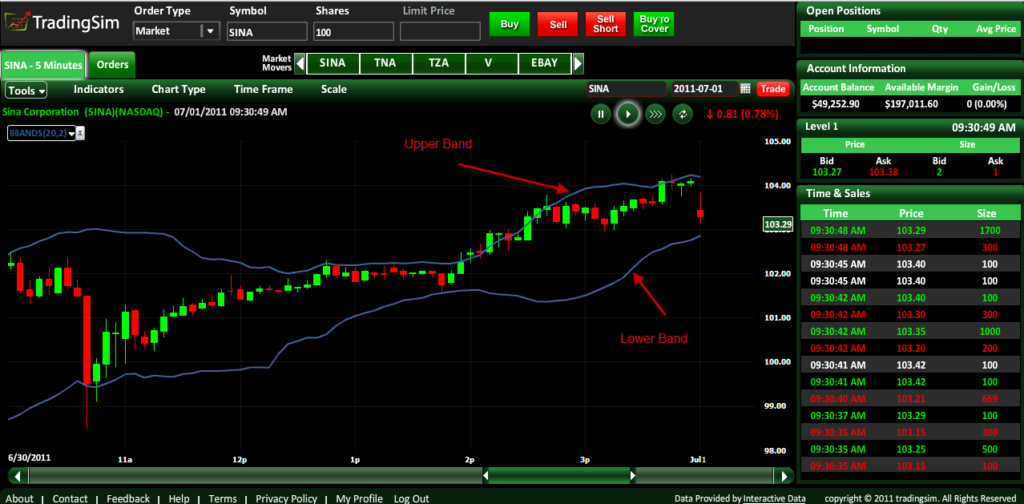
Bollinger Bands are well known in the trading community. You can get a great Bollinger band formula with a simple trading strategy. The Bollinger Bands indicator (named after its inventor) displays the current market volatility changes, confirms the direction, warns of a possible continuation or break-out of the trend, periods of consolidation, increasing volatility for break-outs as well as pinpoints local highs and lows. Bollinger bands include three different lines. The upper, middle, and lower band. The middle band basically serves as a base for both the upper and lower.
- Upper band – 20-day simple moving average (SMA) plus double standard price deviation.
- Middle band – 20-day SMA.
- Lower band – 20-day SMA minus double standard price deviation.
Trade with Star Forex Trader as use your basic trading skills to earn more profit. The below chart illustrates the upper and lower bands.

Bollinger band Squeeze: The squeeze is the central concept of Bollinger Bands. When the bands come close together, constricting the moving average, it is called a squeeze. A squeeze signals a period of low volatility and is considered by traders to be a potential sign of future increased volatility and possible trading opportunities. Conversely, the wider apart the bands move, the more likely the chance of a decrease in volatility and the greater the possibility of exiting a trade.
If the candles start to break out above the TOP band, then the move will usually continue to go UP.
If the candles start to break out below the BOTTOM band, then price will usually continue to go DOWN.

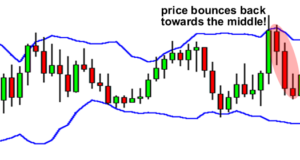
Bollinger Bands Bounce: Bollinger Bands is that price trends to return to the middle of the bands, the whole trading strategy said as Bollinger band bounce trading strategy

The reason these bounces occur is that Bollinger bands act like dynamic support and resistance levels.


