
Forex Candlesticks
What is a Candlestick?
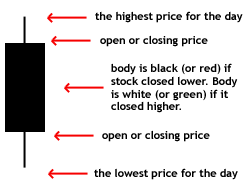
In forex trading, a candlestick is a kind of a price chart that displays the high, low, open and closing prices of a security for a specific period of time while trading. The term has it origination from Japanese rice merchants and traders who used to track market prices and look after the daily momentum in market for hundreds of years before becoming popularized in the United States. The wide part of the candlestick is called the “real body” and tells investors whether the closing price was higher or lower than the opening price (black/red if the stock closed lower, white/green if the stock closed higher). Therefore, for all those who want to deal in forex trading, this is what a candlestick means in trading language.
A candlestick in forex trading is an efficient way to gauge investor’s sentiment. Let us know the important components of a candlestick:
. High Price of the day
. Opening or closing price
. Black or red body (if the stock is closed lower)
. White or green body (if the stock is closed higher)
. Opening or closing price
. Low price of the day
In detail explanation,
As said, candlesticks main idea is to reflect the impact of an investor’s sentiment on security prices while trading and it is mainly used by technical analysts to determine when to enter and exit trades. Candlestick charting is based on a technique developed in Japan in the 1700s for tracking the price of rice. Candlesticks are a suitable technique for trading any liquid financial asset such as stocks, foreign exchange and futures. Talking about the candlestick’s shape, it varies based on the relationship between the day’s high, low, opening and closing prices in the foreign exchange market.
Talking about the components of a candlestick,
The long white/green candlestick indicates that there is strong buying pressure; which means that the prices are bullish in the market and this depends from individual to individual trading patterns. For example, a long white candle is likely to have more significance if it forms at a major price support level. Whereas, long black/red candlestick indicates there is a significant selling pressure upon the trader. This means that the prices are bearish.The pattern is in the form of a hammer, which makes prices moves substantially lower after the open, then rallies to close near the high. The equivalent bearish candlestick is known as a hanging man. These candlesticks have a similar appearance to a square lollipop, and are often used by traders in forex.
Types of candlestick trading patters
Two-Day Candlestick Trading pattern:
This type of pattern indicates that there are many short-term trading strategies in the market which is based upon the candlestick patterns. The engulfing pattern suggests a potential trend reversal; the first candlestick has a small body that is completely engulfed by the second candlestick. It is referred to as a bullish engulfing pattern when it appears at the end of a downtrend, and a bearish engulfing pattern at the conclusion of an uptrend. You will definitely understand this better with the help of Forex brokers.
Three-Day Candlestick Trading pattern:
In this type of trading pattern, the first candlestick continues the uptrend. The second candlestick gaps up and has a narrow body. The third candlestick closes below the midpoint of the first candlestick. That is, a morning star is a bullish reversal pattern where the first candlestick is long and black/red-bodied, followed by short candlestick that has gaped lower; it is completed by a long-bodied white/green candlestick that closes above the midpoint of the first candlestick.
Therefore, forex candlestick patterns will boost your trading profits and make you a good and versatile trader in forex. Like most formations, pin bars in candlesticks can form as either a bullish or bearish signal. The pin bar can be extremely profitable when correctly utilized. So, a candlestick chart (also called Japanese candlestick chart) is a style used as a financial chart to describe price movements of a security, derivative, or currency. Each “candlestick” typically shows one day, thus a one-month chart may show the 20 trading days as 20 “candlesticks”.


